امنیت، هویت، استقرار و تابآوری · فصل ۹ — Resource، Provider، Cost و Organizational Failure · 128
Cost Runaway
Diagnose cost runaway from spend rate, usage drivers, unit cost, forecast and anomaly evidence; distinguish expected growth from abnormal consumption; apply bounded alerts, quotas, admission or shutdown guardrails appropriate to the workload; and prove recovery with a changed-usage scenario without claiming that a budget alert is a hard spend cap. میتواند failure family «Cost Runaway» را بازتولید/تشخیص دهد و detection، containment و recovery مناسب را تعیین کند.
Lesson summary
Diagnose cost runaway from spend rate, usage drivers, unit cost, forecast and anomaly evidence; distinguish expected growth from abnormal consumption; apply bounded alerts, quotas, admission or shutdown guardrails appropriate to the workload; and prove recovery with a changed-usage scenario without claiming that a budget alert is a hard spend cap.
میتواند failure family «Cost Runaway» را بازتولید/تشخیص دهد و detection، containment و recovery مناسب را تعیین کند.
This lesson produces
میتواند failure family «Cost Runaway» را بازتولید/تشخیص دهد و detection، containment و recovery مناسب را تعیین کند.
Who it is for
Foundation
Use a guided boundary matrix and one explicit ambiguity repair.
Repair
Re-run only the failed evidence dimension with a smaller deterministic synthetic case.
Experienced
Start from mixed evidence; require competing explanations, negative evidence and transfer.
Prerequisites
1. Do not equate higher cost with runaway
Cost Runaway means spend rate or unit cost has escaped the declared expected boundary and can keep growing disproportionately to useful output if left unchecked. Higher total cost can be completely legitimate when workload doubles and unit cost stays stable. Diagnosis must combine workload, spend rate, unit cost, and context, not one billing chart.
2. Build a baseline before calling an anomaly
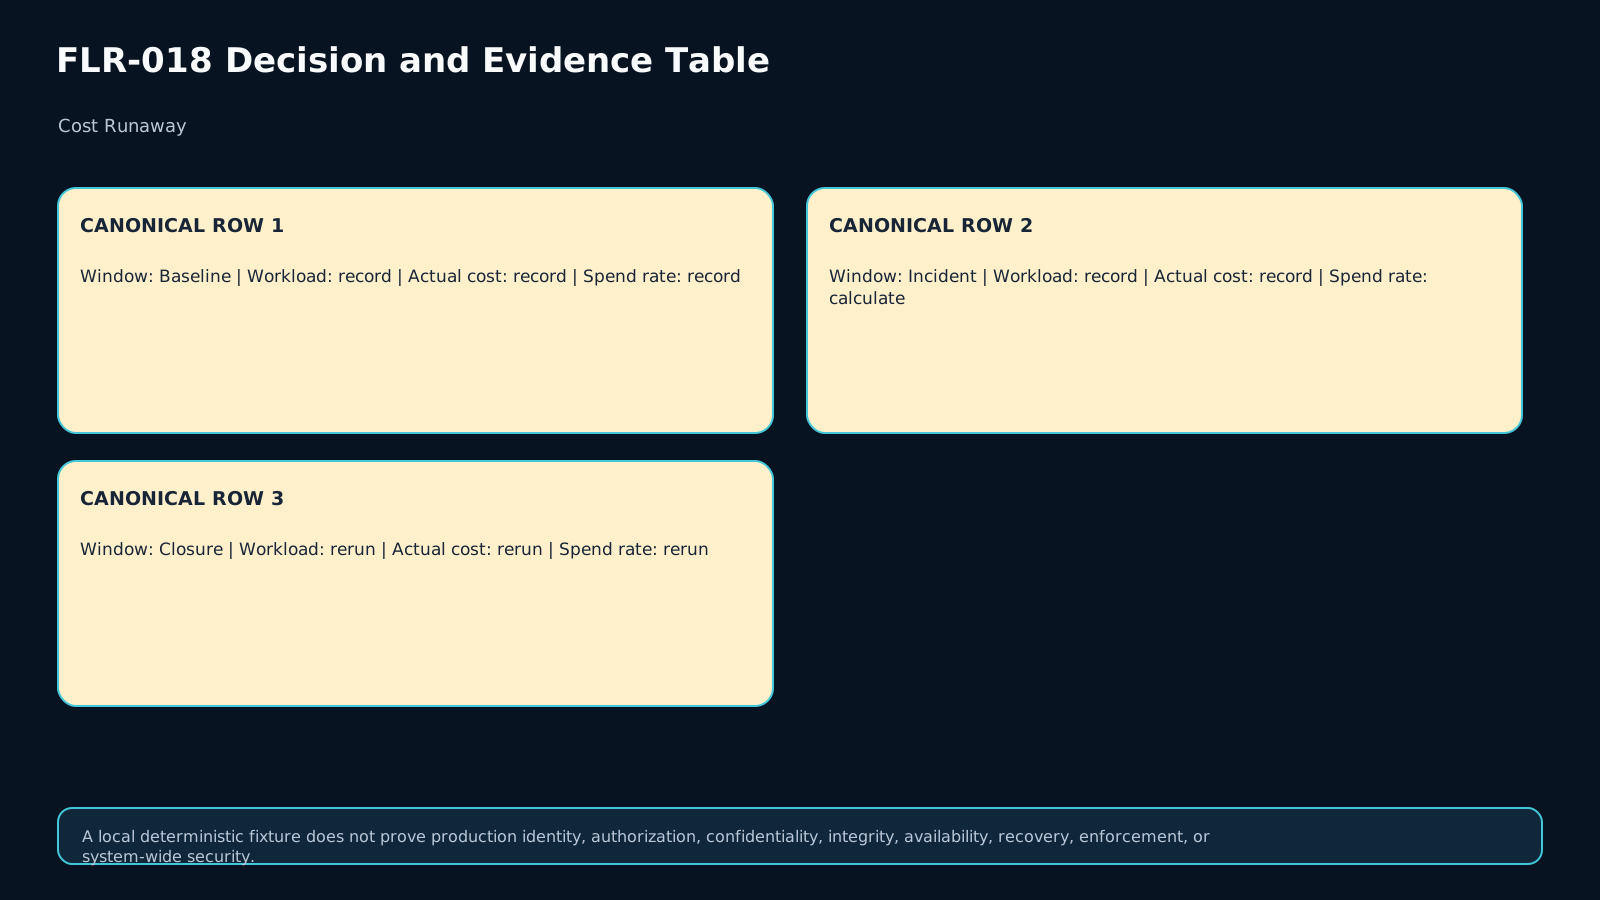
For each window, record workload volume, actual cost, spend rate, unit cost, planned events, and forecast. Without a baseline, a 30% increase could be an anomaly or the natural effect of a release, campaign, batch job, or customer growth. Preserve UNKNOWN rather than guessing when history or billing evidence is incomplete.
3. Spend rate and total spend are different signals
Total spend says how much has accumulated; spend rate says how quickly cost is accumulating. A workload can still be below its monthly budget while its current run rate predicts a breach within hours. For fast containment, run rate is often more operationally useful than cumulative spend alone.
4. Unit cost separates healthy growth from waste
Track cost/request, cost/job, or another useful unit-economics measure alongside workload. If requests double and cost approximately doubles, the increase may be expected growth. If workload stays flat while cost triples, investigate retry amplification, premium tiers, egress, or resource drift.
5. Identify usage drivers from evidence
Do not select a driver from a label or intuition. Bind retry count, provider calls, instance tier, autoscaling events, egress bytes, batch schedule, and allocation metadata to the same cost window. If multiple drivers changed, keep both and mark attribution UNKNOWN where the evidence cannot separate their contributions.
6. An anomaly is deviation from expected behavior, not every increase
FinOps anomaly management compares observed spend with normal or expected spend. A planned launch or batch schedule can sharply increase cost without being an operational anomaly. Conversely, flat traffic plus a retry loop can be a serious efficiency regression even before cumulative spend becomes dramatic.
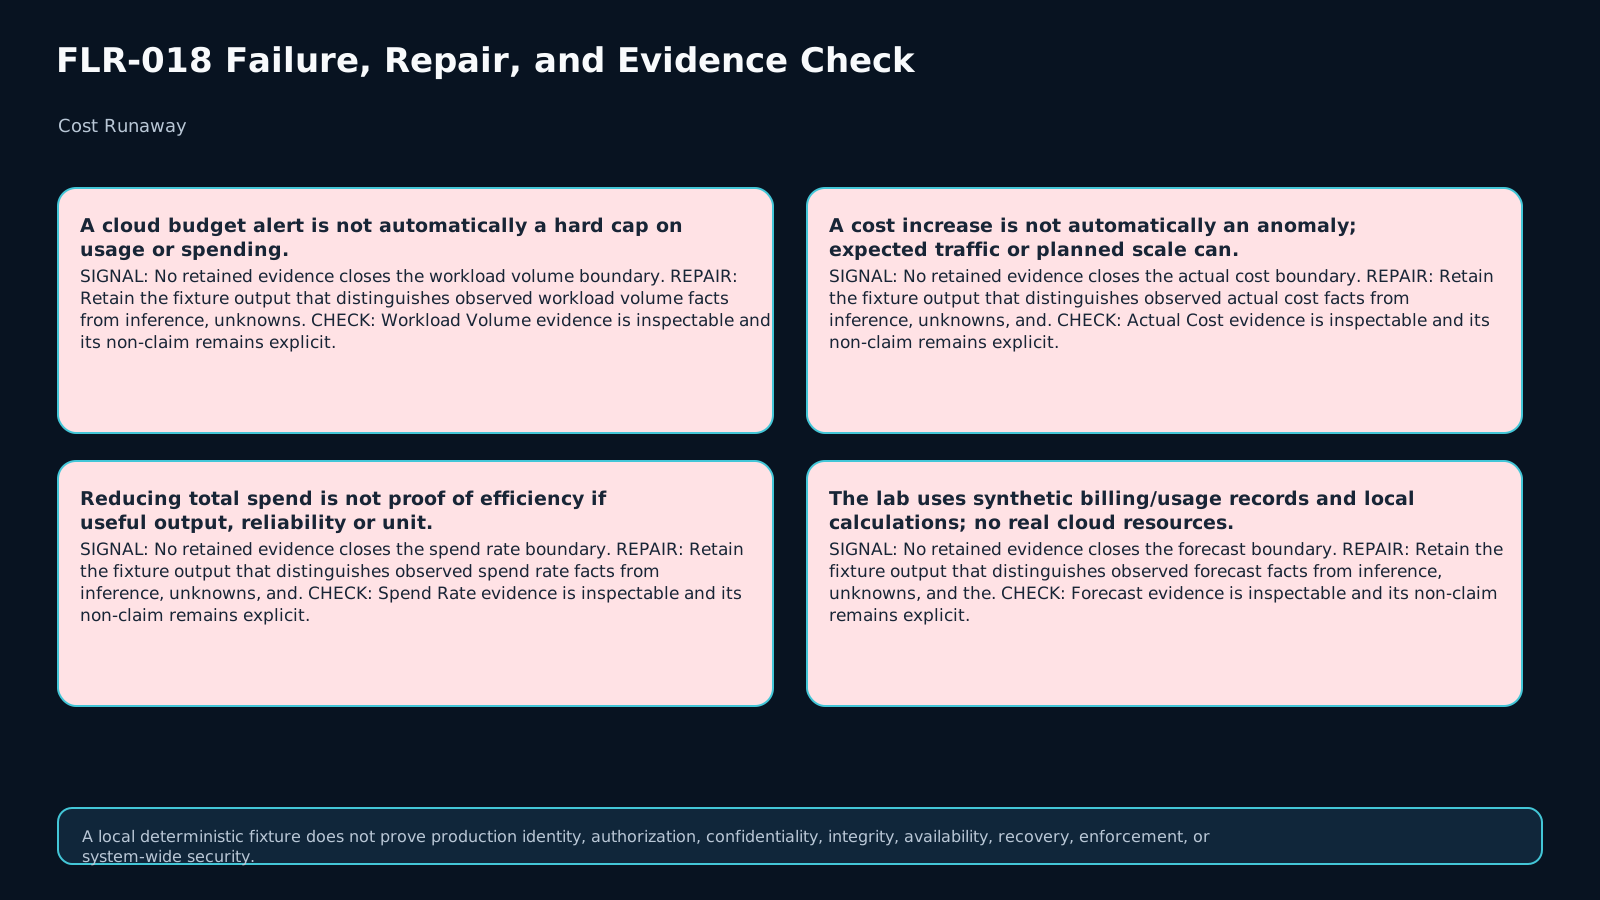
7. Do not treat a budget alert as a hard cap
An alerts-only Google Cloud budget notifies and can trigger downstream action; by itself it does not stop usage. In 2026 Google also offers Spend Cap Budgets in Preview for some eligible services, with explicit scope, latency, and service limitations. The record must therefore state whether the control is an alert, programmatic action, quota, admission control, or enforced cap.
8. Guardrails must be workload-aware and reversible
Cost containment must not blindly destroy the service. For critical workloads, rate limits, admission control, reduced parallelism, disabling a premium tier, or breaking a retry loop may be safer than full shutdown. Design the guardrail against the declared availability floor and business-impact boundary.
9. Containment is not recovery
Containment means unwanted cost growth is bounded. Recovery means the cost driver is corrected and the workload returns to an acceptable state. Closure requires a rerun showing spend rate and unit cost back inside declared bounds while service impact also remains acceptable.
10. Forecast and budget are context, not oracles
Forecasts can be wrong when data is incomplete or new events appear; budgets are policy targets rather than anomaly proofs. Keep actual cost, forecast, threshold, and expected-event evidence together. Actual-versus-forecast deviation is a signal that still requires driver analysis.
11. Lower cost alone is not proof
If a shutdown cuts spend by 90% but violates the service objective or useful output, recovery failed. Closure should keep at least one useful-output or availability signal beside cost metrics. The goal is not minimum cost at any price; it is restored unit economics and spend behavior within declared bounds.
12. Cost Runaway Detection, Guardrail & Recovery Record v1
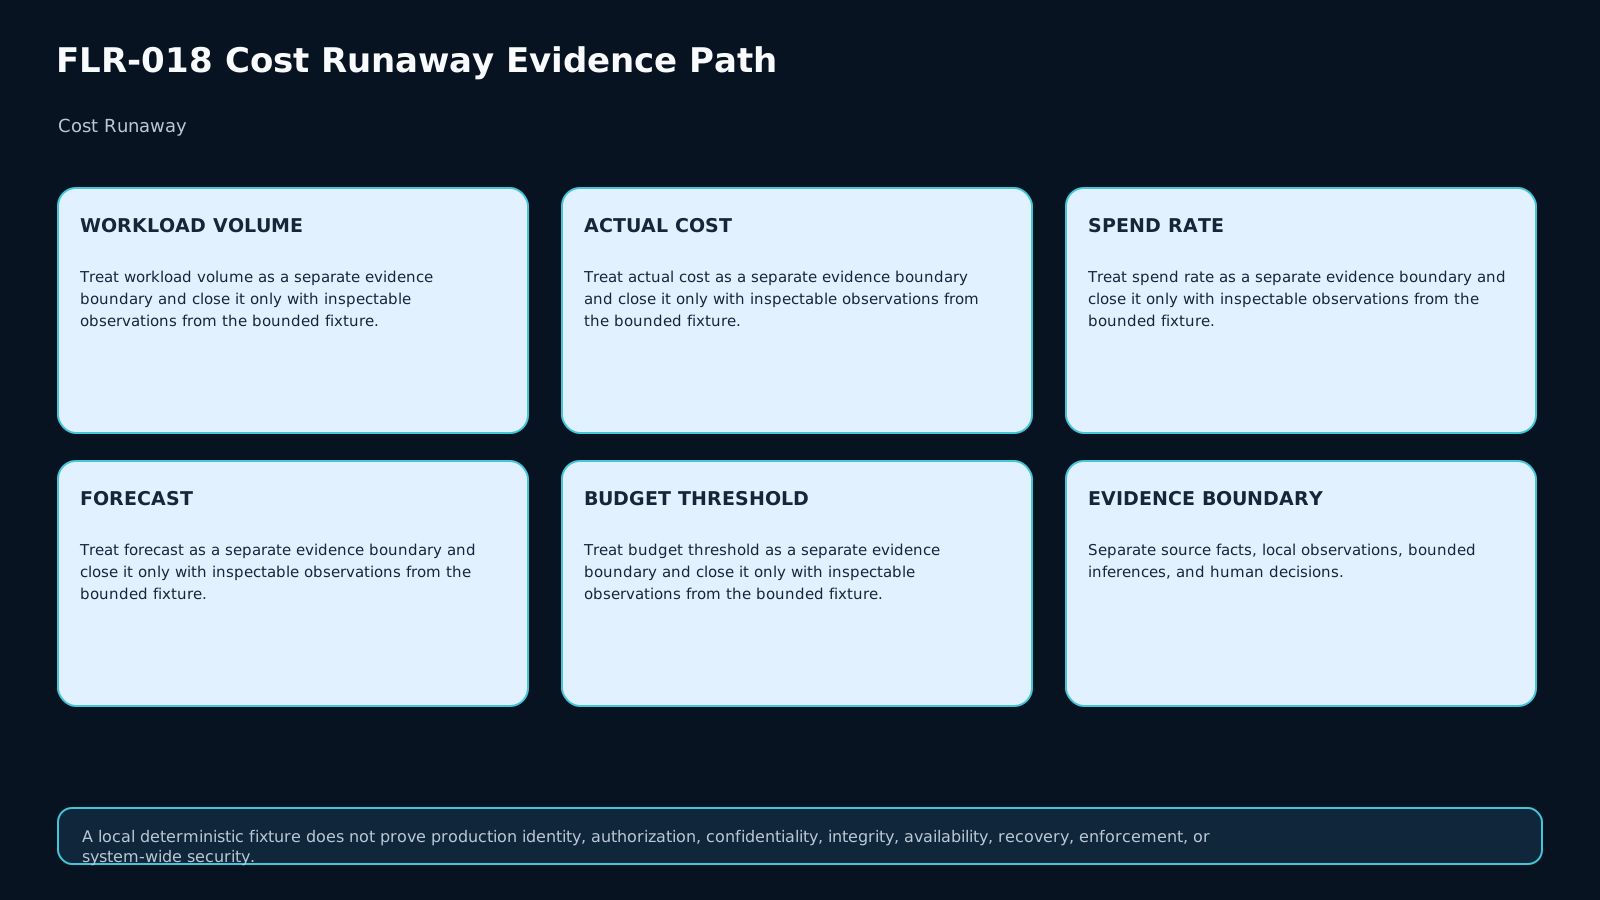
The owned artifact has 13 evidence dimensions: workload volume, actual cost, spend rate, forecast, budget threshold, unit cost, usage driver, expected-growth baseline, anomaly classification, guardrail action, service impact, closure window, and residual cost risk. Each decisive field is labeled as observation, authority/policy, inference, or UNKNOWN.
13. Build classification from multiple signals
The four principal outcomes are EXPECTED_GROWTH_OR_SHIFT, COST_ANOMALY, EFFICIENCY_REGRESSION, and UNKNOWN. Expected growth requires workload/output and cost to rise coherently while unit cost stays inside bounds. Efficiency regression is indicated when cost per useful unit degrades; Cost anomaly applies when spend behavior is unexpected relative to baseline and a driver is evidenced.
14. Lab: eight fixtures and 64 assertions
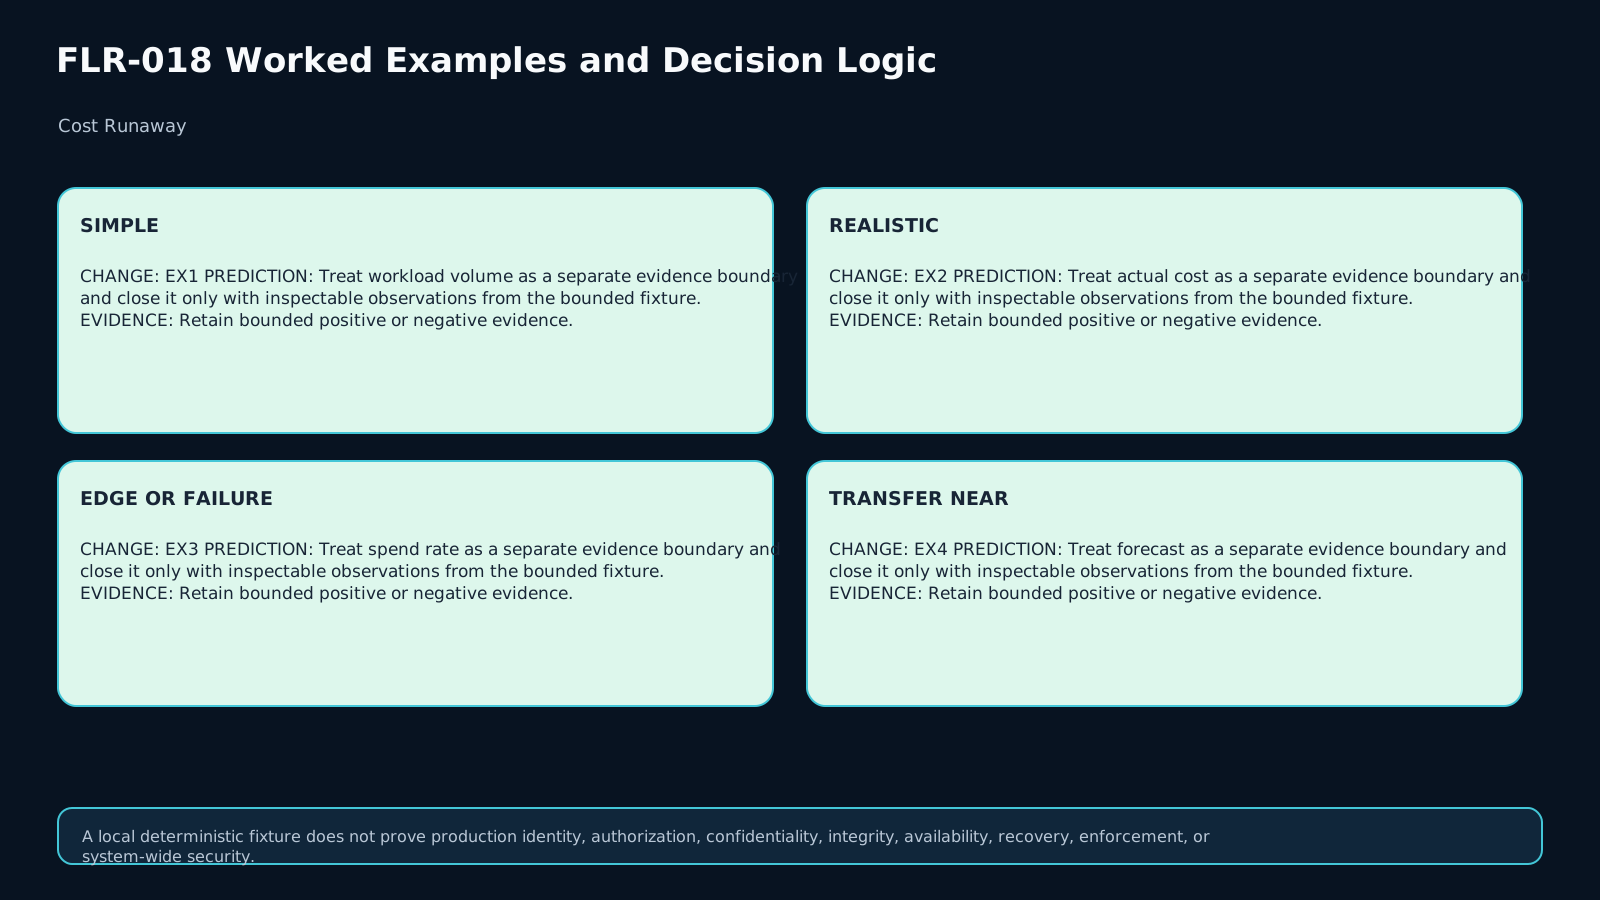
The lab is fully local and synthetic. Eight fixtures cover retry amplification, expected workload growth, flat traffic with retries, an alert-only budget, a hard stop that violates availability, incomplete billing evidence, a transfer case with expected batch+egress growth, and a transfer case with egress-driven efficiency regression. The evaluator emits eight fields per case for 64 deterministic oracle assertions.
15. Exit checklist and transfer
Before exit, explain why the chosen spend increase is or is not anomalous, which usage driver is actually evidenced, what semantics the budget control really has, what service impact the guardrail creates, and what rerun proves closure. In transfer, the retry loop is gone while scheduled batch traffic and egress rise; rebuild classification from the new evidence instead of copying the original diagnosis.
Assessment
There is no answer key in this lesson pack; answer it yourself and mark honestly. "Needs review" sends the lesson to your review queue.
Q1 retrieval
Why is a higher cloud bill not automatically Cost Runaway?
Q2 application
Requests double and total cost doubles while cost/request stays stable. What is the default classification?
Q3 diagnosis
Traffic is flat but provider calls triple because retries loop. What evidence points to runaway?
Q4 decision
Why is an alerts-only budget not enough to claim containment?
Q5 transfer
Retries disappear, scheduled batch traffic starts, egress rises, and unit cost worsens materially. How should the old diagnosis be used?
Assessment rubric
A sufficient response establishes a workload/cost baseline, distinguishes total spend from spend rate, calculates or bounds unit cost, identifies usage drivers from evidence, preserves UNKNOWN when billing data is incomplete, and separates alerts from enforced controls. Closure requires a repeatable rerun showing the abnormal driver is contained or removed, spend rate/unit cost return to declared bounds, and useful workload or service impact remains inside the stated floor. Transfer must be rebuilt from the changed batch/egress evidence rather than copying the original retry diagnosis.
References & freshness
Case studies
Lesson visuals
Lab files
Implement the bounded evaluator in starter.py for the eight supplied synthetic cases. No network calls or real cloud resources are needed. Keep workload growth, actual cost, spend rate, unit cost, expected-event evidence, retry/premium/egress drivers, budget-control semantics, and service impact as separate evidence dimensions. A higher bill alone is never enough to classify Cost Runaway. An alerts-only budget is detection evidence, not proof of containment. Preserve UNKNOWN when billing evidence is incomplete, and do not claim closure when the chosen guardrail violates the declared availability floor.
Run python run_checks.py to verify fixture shape before implementing the evaluator.
Lesson media & slides
Teaching files (download)